I used an LLM to summarize an incident slack channel. At a casual glance it looked like a decent enough summary. But on closer analysis, the LLM got it exactly backwards. This scares me. Casual inspection will mislead people to trust the summaries. And actions taken in response will make things worse.
We have many kubernetes clusters. Security was on a months-long journey to carefully introduce a tool to all of the clusters that would scan the filesystem for vulnerabilities.
There were recurring incidents with recurring arguments between Security and the SREs about whether the new tool was causing the disruptions. The symptoms and behaviors were rich with ambiguity. As each incident resolved, the arguments were not. The mechanism of failure remained elusive. Security continued introducing the tool to successively larger clusters.
During the specific incident that was summarized, Security and SRE were again arguing. There were a lot of words in the slack channel about the tool and two different clusters. The two clusters were in the same region and shared the same external load balancers. Call one of them the "experiment", where the tool had been applied. Call the other one the "control", where the tool had not been applied.
The presenting symptoms featured disruptions in both the "control" and the "experiment" clusters. This appeared to support Security's argument that the problem couldn't be from applying the tool. Many words were traded including disagreements about a previous incident and how it was resolved.
There was at last a one sentence explanation given for the unexpected behavior in the control cluster. The SREs explained that the shared load balancers were known to be sensitively tuned. The increased latency in the experimental cluster cascaded into failures in the shared load balancers and thereby impacted both clusters.
The critical insight that drew SRE attention to the load balancers was a short recognition of absence of evidence in the third cluster from the previous incident where the tool had been rolled back.
The LLM claimed that the incident was resolved when the tool was deployed to the control when in fact they removed the tool from the experiment. The LLM got it exactly backwards. Someone in a hurry and not following closely but skimming the actual messages in slack and comparing the LLM summary would conclude it was close enough. Ship it.
To follow what actually happened would require a clear understanding of the flow of the insights and disproof. And it requires understanding of both the absence of evidence, the surprising cascade of impact, and even the absence of words in the transcript when the argument was settled and action turned to removing the tool and rebooting the load balancers.
I don’t think the statistical foundations of LLM machinery can catch that. There were so many words in the conversation about the wrong conclusions and too few words about the actual resolution.
Conventional thinking in the software industry—what we call our best practices—sees incidents as an irritating interruption that slows progress against our roadmap. Whatever the most recent failure is, we seek minimum viable fixes to prevent the failure from ever happening again. The range of solutions that can be considered are limited to whatever minimizes disruption to our existing plan. We add alerts, add dashboards, update a runbook, and maybe instrument our code with more logging or tracing. The often unspoken pressure to maintain velocity and get back to the planned work hangs over retrospectives confining what participants will even consider.
There are a few pockets of excellence adopting a different paradigm where incidents are seen as an opportunity to uncover some of the most important insights about our software and our business. Incidents can fuel powerful innovation. Of course we will continually improve the robustness of our systems as we learn new ways they can fail. And there is so much more.
Software design aims to reshape, mold, and change reality. But reality pushes back against our designs—everywhere our systems contact the world we find the world demanding changes to our designs. Paying attention to these points of friction is a way to get a better fit between our code and the world we are trying to improve.
Design and Reality
In Design and Reality: Reframing the problem through design, Mathias Verraes and Rebecca Wirfs-Brock
[1] describe a moment of insight that resolved tensions in their software design and opened new opportunities. Wirfs-Brock was invited to consult for a company that makes hardware and software for oil rigs. Early in her contract, a competitor’s oil rig exploded in the gulf, motivating their team to look closely at how their own software performed during incidents.
Consider how unusual this is in the software business. The incident wasn’t for their team. It wasn’t even their company. Yet Wirfs-Brock led her team to take their competitor’s misfortune as an opportunity to reflect carefully on their own system to see what there was to learn.
Their initial model assumed alarms are directly connected to emergency conditions in the world. The software’s image of the world was distorted: when engineers turned off the alarm, the software assumed the emergency was over. But it was not. Turning an alarm off doesn’t change the emergency condition in the world. Reflecting on an incident outside of their company, the team discovered a distinction between the alarm sounding, and the state of alertness. They adapted their model to decouple the emergency from the sounding of the alarm by introducing "alert conditions" in addition to "alerts".
There was a missing concept, and at first the team didn’t know something was missing. It wasn’t obvious at first, because there wasn’t a name for “alert condition” in the domain language. The oil rig engineers’ job isn’t designing software or creating a precise language, they just want to be able to respond to alarms and fix problems in peace. Alert conditions didn’t turn up in a specification document, or in any communication between the oil rig engineers. The concept was not used implicitly by the engineers or the software; no, the whole concept did not exist.
…
These creative introductions of novel concepts into the model are rarely discussed in literature about modeling. Software design books talk about turning concepts into types and data structures, but what if the concept isn’t there yet? Forming distinctions, not just abstractions, however, can help clarify a model. These distinctions create opportunities.
Also noteworthy, it often isn’t sufficient to discover a different way of thinking about the business problems. Wirfs-Brock’s team invested the time to improve the design of their software with something not previously on the roadmap.
Generating Insight
There’s an enormous competitive advantage for making this paradigm shift to treat incidents as a source of insight and innovation. This idea comes from Gary Klein, a research psychologist famous for pioneering work in the field of naturalistic decision making—how experts make effective decisions under pressure
[2].
He shares three paths to generate insight: contradictions, connections, and creative desperation
[3].
Incidents are a rich source for insights using all three paths.
What contradictions do we see?
How does this process usually work?
And what made it work differently this time?
What surprised us?
What were we expecting to happen and how did reality turn out differently?
What aspects contributed to this failure that were originally added to prevent previous failures?
[4]
What connections can we find?
Do other people here see similar symptoms?
How have others responded to similar situations?
Who had the expertise to mitigate and how did they know what to do?
Who was it that knew how to navigate the organization to find the right people?
What can we learn from creative desperation?
When time was running out and limiting our options, what policies did we have to break?
What assumptions did we drop in order to resolve this incident?
Should we change the rules now that we’ve seen how they play out under real pressures?
Most of the time we don’t notice the partial degradation ever-present in our complex systems. We build in redundancy and keep everything running despite dark debt and known limitations
[5].
We can predict a steady stream of incidents. It will take more time and effort to consider these questions than the more typical and more shallow interventions of estimating impact, measuring time to detect, adjusting alert thresholds, or adding to the runbook. But insights into your business may uncover opportunities you would otherwise miss.
Thanks to Will Gallego, Fred Hebert, and Vanessa Huerta Granda for valuable feedback on early drafts. This is a much more focused story than where I began.
[1]
Rebecca Wirfs-Brock was the lead author on two pioneering books on object-oriented design, Designing Object-Oriented Software, 1990, and Object Design: Roles, Responsibilities, and Collaborations, 2003.
https://www.wirfs-brock.com/DesignBooks.html
Resilience is human skills and human relationships. Reliability is what we build into our software. There are four different concepts that get lumped into conversations about resilience and reliability. This post uses software engineering examples to clarify the four different meanings of resilience from Dr. David Woods paper: Four concepts for resilience and the implications for the future of resilience engineering. Reliability Engineering and System Safety 141 (2015) 5-9. PDF at researchgate.
rebound—returns to previous level of function
There are many common examples of rebound. We’ll name a few and trust your own experience to fill in with other examples. Roll back a deploy. Restore lost data from a backup. Reboot a server. Restart a container. Truncate log files to free up disk space. Follow the instructions in a runbook. Basically, this is anything you do to put some sub-system more or less back the way it was.
robustness—copes with predictable challenges
Robustness is what we build when we automate common rebound scenarios. Monitoring and alerting are the most basic measures. We build one component to monitor another and call in the humans if some threshold is crossed. Kubernetes comes with built-in behavior that kills containers that run out of memory and other behavior which restarts containers when they fail. Common practice for databases includes having read-only replicas, hot-standby replicas, or automated failover. Load balancers include built-in health-checks for the servers they’re balancing and will adapt to send traffic only to the healthy servers. One of the most common reasons people want to move to the cloud is to enable autoscaling, where the systems can adapt to extra traffic by spinning up more containers and then spin down those extras when the surge in traffic subsides. More sophisticated examples of robustness include bulkheads, circuit breakers, and automated chaos experiments.
The basic idea behind most of these interventions is that we build the system to adapt to failure modes we know can happen. That is also one of the key weaknesses of robustness measures. Every automation that handles some known failure becomes something new that can fail in a surprising way. Or the measures we put in place get tested by loads that exceed their response.
graceful extensibility—changes performance to meet urgent new challenges
When circumstances change in surprising ways, especially under pressure, we must change goals. Every adaptive part of a complex system, at any scale you examine, needs ways to stretch and change under pressure. Every part has limits. Stuff happens that exceeds those limits. We gracefully extend under these pressures or we collapse in brittle failure. The best example we have of graceful extensibility in the software business is incident response. Once we detect that some part of our system is getting overwhelmed or otherwise misbehaving, some group of us drop what we’re doing to prevent the problem from getting worse and to remediate.
sustained adaptability—maintains ability to adapt to new surprises
This is Woods’ most demanding concept of resilience. All systems reach their own previously known limits. This happens almost continuously. People in the systems continually stretch the systems to adapt to new circumstances. Successful components in the system induce demand that exceeds their original design. It is completely predictable that something will fail under the changing conditions. The specifics of what will fail and when is less predictable.
There are always multiple, competing trade-offs at work in successful systems. Sustained adaptability calls on us to identify the trade-offs and monitor how we balance and prioritize among them to protect our capacity to continuously adapt the system.
We have a few examples that address sustained adaptability. Many teams are adopting operational review meetings which is an excellent practice to help monitor how the ecosystem around them is changing and how their services are responding to the relentless change. Creating a Learning From Incidents team to conduct cognitive interviews, facilitate learning reviews, and generally help other teams broaden and deepen what we learn when circumstances overwhelm our sub-systems.
We need both resilience and reliability
Improving reliability calls for building robustness wherever it makes sense balanced with customer facing product features. Improving resilience calls for practicing and extending our skills, describing and sharing our expertise and experience, and prioritizing our work differently. Resilience is about us humans. Improving it looks more like the school of hard knocks, mentoring, apprenticeship, or learning and development.
Husband, dad, friend, brother, son, uncle, cousin; programmer, martial artist, teacher, downhill skier, and thinker. I used to write and publish a lot of prose here back when I was a lot more sure the world needed to hear what I was thinking. I write a fair bit of code: github.com/dobbs. I sometimes microblog: rls.social/@dobbs. I used to tweet: @dobbs. In the early 2000s, I contributed to the Turbine project at the Apache Software Foundation: committers.
My career has turned towards learning from incidents in complex software systems.
I am a systems adventurer and a resilience engineer.
I am one of the federated wiki core contributors. I study Ward Cunningham's practices like I study aikido shihan. I watch closely how they work and then copy what I can see to gradually build skills of my own. I have, among other things, created several wiki plugins, experimented widely with ways of hosting wiki servers, and used wiki pages as a database for a single-page javascript applications. I started the Graphviz Plugin and then collaborated with Ward as he added a small programming language to it. I created the Frame Plugin and especilly the protocol that lets HTML scripts and wiki pages communicate. I added HTML5 to the video plugin. I got calendar plugin to share values with method plugin. My main wiki is hosted in digital ocean via docker compose: github. I used to run a wiki on my laptop using kubernetes: github. I extended Nick Neimier's work to get wiki running in glitch: wiki-wiki.glitch.me. I also have a few wikis running in github pages: wander.dbbs.co.
Eric Dobbs can also introduce himself in the third person, in case you need that.
Eric Dobbs is a principal incident analyst. A self-taught programmer, he's been writing code recreationally for over four decades and professionally for three. He has also practiced aikido for over three decades and taught for two of those. His career has meandered through education, consultancies, government, non-profit, and businesses from startup size to Internet scale. He started deliberately practicing learning from incidents in 2018 as part of the SNAFUcatchers consortium. He holds a bachelor's degree in environmental design from the University of Colorado and a fourth-degree black belt from Boulder Aikikai.
An experience report from measuring uptime. Many software people believe measuring uptime to be a useful tool to support or assess improvement in software reliability. My experience is different.
I joined a team at an internet scale company whose job was to manage an incident chat bot and related incident database. The main job of the database was to track uptime for teams and products. It’s the best calculator of uptime I’ve seen through my career and better than most I’ve heard of from other engineers. It is the kind of tool most software companies think they want.
But I’m telling you this story in the month of October as a horror story and a cautionary tale. The cliché summary: be careful what you wish for. The conclusion up front:
measuring uptime is deceptively expensive and inaccurate
reporting lapses in uptime leads to counterproductive behavior
using lapses in uptime to trigger mechanical consequences destroys morale
The Calculator
The chat bot’s main job was to support incident response. It had a bunch of features. But for this story we’ll focus on how it helped with calculating uptimes. The bot would record the start time and end time of any incident along with any time severity changed over the duration of the incident.
After an incident, teams were expected to estimate the customer impact for each of the major products and for each of the severity timespans over the duration of the incident.
One of the expected outcomes from an incident retro was to identify which team owned the impact for the incident.
From this data, we would generate reports of uptime expressed as number of nines, adjusted by the percentage of customer impact. So 99.5, 99.7, 99.8, whatever was happening for a specific group.
These were broken down by both team and product and grouped over the past three months, alongside the past 30 day rolling window. The cells were colored green, yellow, or red according to team-specific or product-specific objectives for uptime. Reports were delivered in a weekly email to pretty well everybody in the engineering organization.
Context
These tools were built alongside a deep investment in nurturing a world-class incident response culture. For example, a self-guided training module was required as part of onboarding every engineer to teach them how to use the chat bot, how to run an incident, and how to know when to escalate. There were a lot of beneficial returns on the investment of developing that kind of culture. It is tracking uptime that I hope to discourage.
Deceptively Expensive
These tools had been under development by a team of about four engineers for four years at the time I joined the company. This level of investment doesn’t seem particularly outlandish. At the time I joined the company there were about 500 developers—a back-of-the-envelope estimate of 1% of engineering effort is maybe even inexpensive.
One hidden expense was that the longer incidents created more expensive data collection and data entry. They included ups and downs in severity; symptoms would cascade from one product area to another. Where those cascades started or ended were hard to identify and didn’t correlate cleanly with the changes in severity. Each change in severity and cascade of impact would surface ambiguous boundaries for estimating impact. The more complex incidents involved many teams and many products. This further multiplied the ambiguity, difficulty, and costs of estimating impact.
Another unexpected outcome grew out of the ownership of incidents. Ownership was meant as a kind of accountability. But many retros would fixate on “who owned the impact?” or reassessing the impact instead of surfacing the things that would actually improve our incident response and service to customers: discovering mechanisms of failure, communication breakdowns, or places where the existing architecture wasn't keeping up with the customer growth.
Probably the most popular feature request that we got on the team was to allow incidents to share ownership between the teams involved. This was also the hardest thing for us to implement: it would have required a significant amount of change in the database schema and related calculations, and would have doubled (or more) the complexity of an already difficult and costly UX.
Best of Intentions
So time passed. We had a pretty rough couple of months over one August and September. It was in October (oh hey! an anniversary!) when leadership implemented a new policy: a kind of targeted code freeze. If teams entered the red, they were expected to stop feature development, and develop a plan that focused on reliability engineering. The plan had to be signed off by their VP and would include specific exit criteria that would enable them to resume work on their existing roadmap.
As teams encountered the new policy, it became universally hated. This memory is particularly acute for me because not long after the venom started flowing, I wrote an impassioned defense of the new process. Teams have an accumulation of technical debt. We know there are areas that get neglected. And the purpose of the policy was to create organizational cover, to buy time for teams to be able to invest in cleaning up some of that neglect.
What I learned in the ensuing backlash from my blog post is that leadership were not universally aligned on the new policy. In some parts of the company the pressure to keep to our roadmaps was higher than the pressure to preserve reliability. It seemed few leaders were adjusting their schedule when they entered the code freeze. Many kept to their expected deadlines. A few former colleagues remember it this way:
One thing that I witnessed during this time frame was managers wrangling with each other over who would “own” the incident and be forced into [the code freeze]. Rather than doing what was best globally, they were both trying to optimize locally for their team. And, it led to misleading ownership that was assigned not for good reason, but so that managers could save their own SLAs and push things on to other teams who hadn’t used up their budgets yet. So, in essence, the game became “how to not be forced into [code freeze]” rather than “how to most effectively fix our overall system.”
For these teams, the result was perhaps the worst of policy outcomes. Teams already most exhausted from recent incidents were now getting double the demands of their time. Instead of us creating cover, the policy was doubling the workload on the teams already collapsed from overload.
I should add that other former colleagues remember some mixed or positive outcomes from the policy—not uniformly terrible.
I remember feeling pretty defensive (which is, like, the least useful emotion to have ever) and yes, it became more about “getting my team out of [code freeze]” in addition to fixing the underlying problems. Because it felt like the focus was more on “Here are the hoops the team needs to jump through to get out of [code freeze]” rather than (but, to be fair, in addition to) “here’s how we get better as a company”. We ... really didn’t need that split focus, IMO. We didn’t need hoops to jump through, or “reliability training wheels”. We had enough engineering excellence gravity that was already pulling us toward Doing the Right Thing. [Code freeze] was just noise on our end. Needless friction.
While preparing this report, I got feedback from one of the former VPs who put a ton of their own time into ensuring incident data was filled out thoroughly despite having very good automation around collecting that data.
I’ll reiterate: it was deceptively expensive to get good data into the system. Teams who were already displaying internal motivation to balance their reliability engineering with feature development were the ones making the extra effort to provide better data. But as cited in the earlier quote, they were also the teams who were least in need of “reliability training wheels.”
I further learned that the report itself had a subtle effect of shaming teams by publicly drawing attention to their team in red. This had the effect of suppressing the reported severity of incidents. Low severity incidents could skip the extra data entry and accounting visibility.
These features had the combined effect of converting the reliability work into a kind of punishment.
But there’s more. As I looked more closely at the data that was in our database relative to the incidents that I witnessed, I recognized that every piece of data we had was being negotiated during the incidents.
They weren’t crisp measurable points. They were all judgment calls. Every one of them.
What’s more, there were existing company processes related to customer root cause analysis documents our team was involved in that further negotiated the customer impact reported to customers. When a customer would demand a report, say after a bad month, our job was to identify the incidents over the span of that report that would have affected the customer based on what we had, which products were affected, and which products that customer was paying for.
So a great deal of effort was spent on our part to clean the data and double-check with teams who had maybe not finished their data entry on the customer impact to ensure that that customer’s impact based on the incidents over the period was focused on only those things that could have affected them.
And I don’t want to suggest that the work we were doing for the RCAs was in any way deceptive. I think it was appropriate. But what I do want to make clear is that it was very expensive.
Only my teammates and I could actually see how much it was costing the company to collect the data. It was spread thinly across every single team, hidden in ordinary day-to-day work. The resulting numbers were based on judgment calls. For the many teams where roadmaps and schedules remained even under the code-freeze, all these very expensive-to-collect numbers failed to reduce technical debt or otherwise improve reliability.
The costs to morale across the company were substantial. And all of it further undermined the quality of what the company learned from incidents because so many were too busy fighting over who owned the impact.
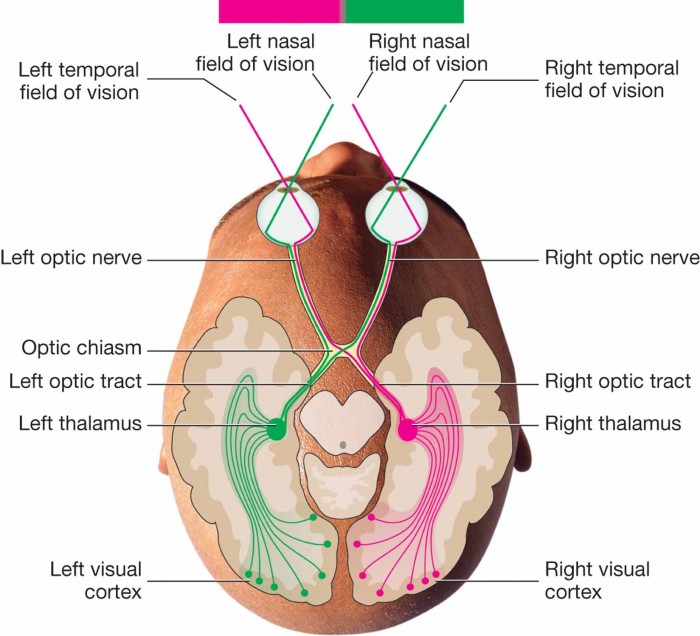
Light strikes the retina and signals fire along the optic nerves, through the optic chasm, through the optic tracts and into the left and right thalamus on route to the visual cortex at the back of our brain. Before the signals reach the visual cortex, they must first pass through the limbic sections of the brain, that is, the emotional center.
By the time our brain has started to gather the shape and color and symmetry of whatever we see, long before we have words for what our eyes have met, we already have an emotional reaction. The language cortex and prefrontal cortex are almost literally the last to find out what's going on.
Riot or revolution?
When we see violence in the street, the word that appears in our mind reveals our emotional position to that violence. If we see a "riot", our heart is with the establishment. If we see a "revolution", our heart is with the protestors.
The same general principle applies for all of our senses. We are emotional creatures first and only occasionally have fits of reason. There really is no such thing as "being reasonable." We rationalize our emotional state, but we are not actually rational.
Today's date, numerically encoded according to US conventions: 3/16/15
The time this article posted (Mounatin Daylight Time): 07:02
Woo Hoo! π day all over again.
If you casually ignore the first two digits of the Year of Our Lord. And ignore that I actually faked the publication date and time. And ignore that the Year of Our Lord is at best an approximation. And ignore that there is no 0 between 1BC and 1AD on The Number line of Our Lord. And if you ignore that at least 2/3rds of the world disagrees about the "Our Lord" part. In general you kinda have to overlook that everything about this exciting temporal milestone is layer upon layer of arbitrary human convention.
I mean, except for the ratio of a circle's circumference to its diameter and the corresponding conversion from a base ten representation of that ratio to the base eleven representation.
But by all means, don't let any of that stop you from celebrating this momentous occasion with a slice of pie.
I'm actually more excited about τ in base eight day: 6.2207732504205. If you arbitrarily chose a point close to the international date line, you could almost celebrate THAT day on the solstice. Tau Day.
I rushed out to catch the bus for fear of missing it. There was only
one other person waiting. I needn't have worried. There's a whole
story in there about unnecessary fear. But that's not today's story.
I recognized the woman waiting at the bus stop. I've seen her fairly
often on the bus. Our schedules are similar.
She's beautiful.
We're waiting together for the bus. Just the two of us. It's dark
out. She's looking at her phone.
I take out my phone too. I put my phone away. Feels awkward.
Then I see a couple men walking along the sidewalk in our direction.
The one looks her up and down.
And then. As he's passing us.
His. Head.
Follows her.
His. Eyes. Locked. On. Her. Face.
Too agressive. I thought. The moment passed with them as they
proceeded along, yet her gaze seemed to follow him.
Or she might have been looking down the street to see if the bus was
coming.
That felt creepy.
I should ask her if that was creepy to break the tension.
I thought.
That's what micro-aggression looks like, right? Would it help if I
said something?
I thought.
What if he'd actually stopped walking to talk to her? I think the
unspoken social contract calls for me to intervene. Nevermind social
contract, my gut was already preparing to step in if things escalated.
"Move along," I imagined saying to him.
"What? Is she your girlfriend?" He asked knowing the answer.
I imagined her awkward body language at me picking a fight with a
stranger to protect her from the escallating microagression. Was that
fear that things would get out of hand? Or was it relief to not be
standing alone at the bus stop?
I should ask her if that was creepy to break the tension.
This time she was a skilled martial artist. Her body language was
angry at me for assuming she needed my protection.
I should ask her if that was creepy to break the tension.
I thought.
But how is my impulse to talk to her any different than his stare?
Would that break the tension or just pile on? Am I just looking for
an excuse to talk to a beautiful woman? Am I competing for her favor?
I thought.
This time things escalate. He's armed with a knife. I wake up
briefly in the emergency room. Images of my young children playing at
home, then interrupted by the sound in my wife's voice as she gets The
Call. The joy on their faces melts to puzzled, worried looks as I
fade to black.
I thought.
This time I'm waiting at the bus stop with a man. The gut check is
completely different. He's got this. It would be insulting to step
in. None of my business, anyway.
I thought.
This time I know she's transgender. This is an unexpected variation.
She's beautiful. Did he know her before the operation? There's no
hello nor even a nod nor raised eyebrow. Still my gut steps in to
defend. "Move along."
I thought.
This time she's ugly. How does this one plays out? Does he even
pause in his step? Was it about her beauty? Or was it the sense of
power? As he gets further away I notice a subtle weave in his path.
It's dark, but way too early to already be drunk. Was this stare the
best he can do for a power trip? An angry reaction to being out on a
Friday night with a friend instead of a date. If he does stare and
then stop, does my gut step in? Or am I only interested in competing
for the favor of a beautiful woman?
Why am I still thinking about this? I thought.
Unnecessary.
Should I ask her if that was creepy?
Fear.
Was she creeped out by standing alone in the dark at the bus stop with
me? I was watching him, not her. Could her face have been pleading
to him for protection from me?
What images do you think of when I ask you about the invisible part of design... the lines and shapes and proportions that make your design hang together in a coherent way?
I'm writing an article to teach computer geeks about design and to explain why CSS sucks as a language for designers. I need some visual support to explain the invisible. Words aren't going cut it. Although beautiful images about typeface design would work nicely. :-)
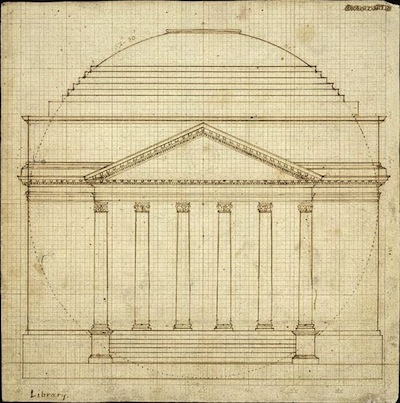
I've got a few examples here: two from architecture, one a study for a figure drawing. These are in the right direction, but I'd lovee images from many other design disciplines.

